Understand my dashboard
This page explains all the key performance indicators you can find in our dashboard.
Real Time Computing
All the KPIs and metrics exposed in the dashboard are computed in real time. Every time you refresh your page, you get new metrics or consent rate.
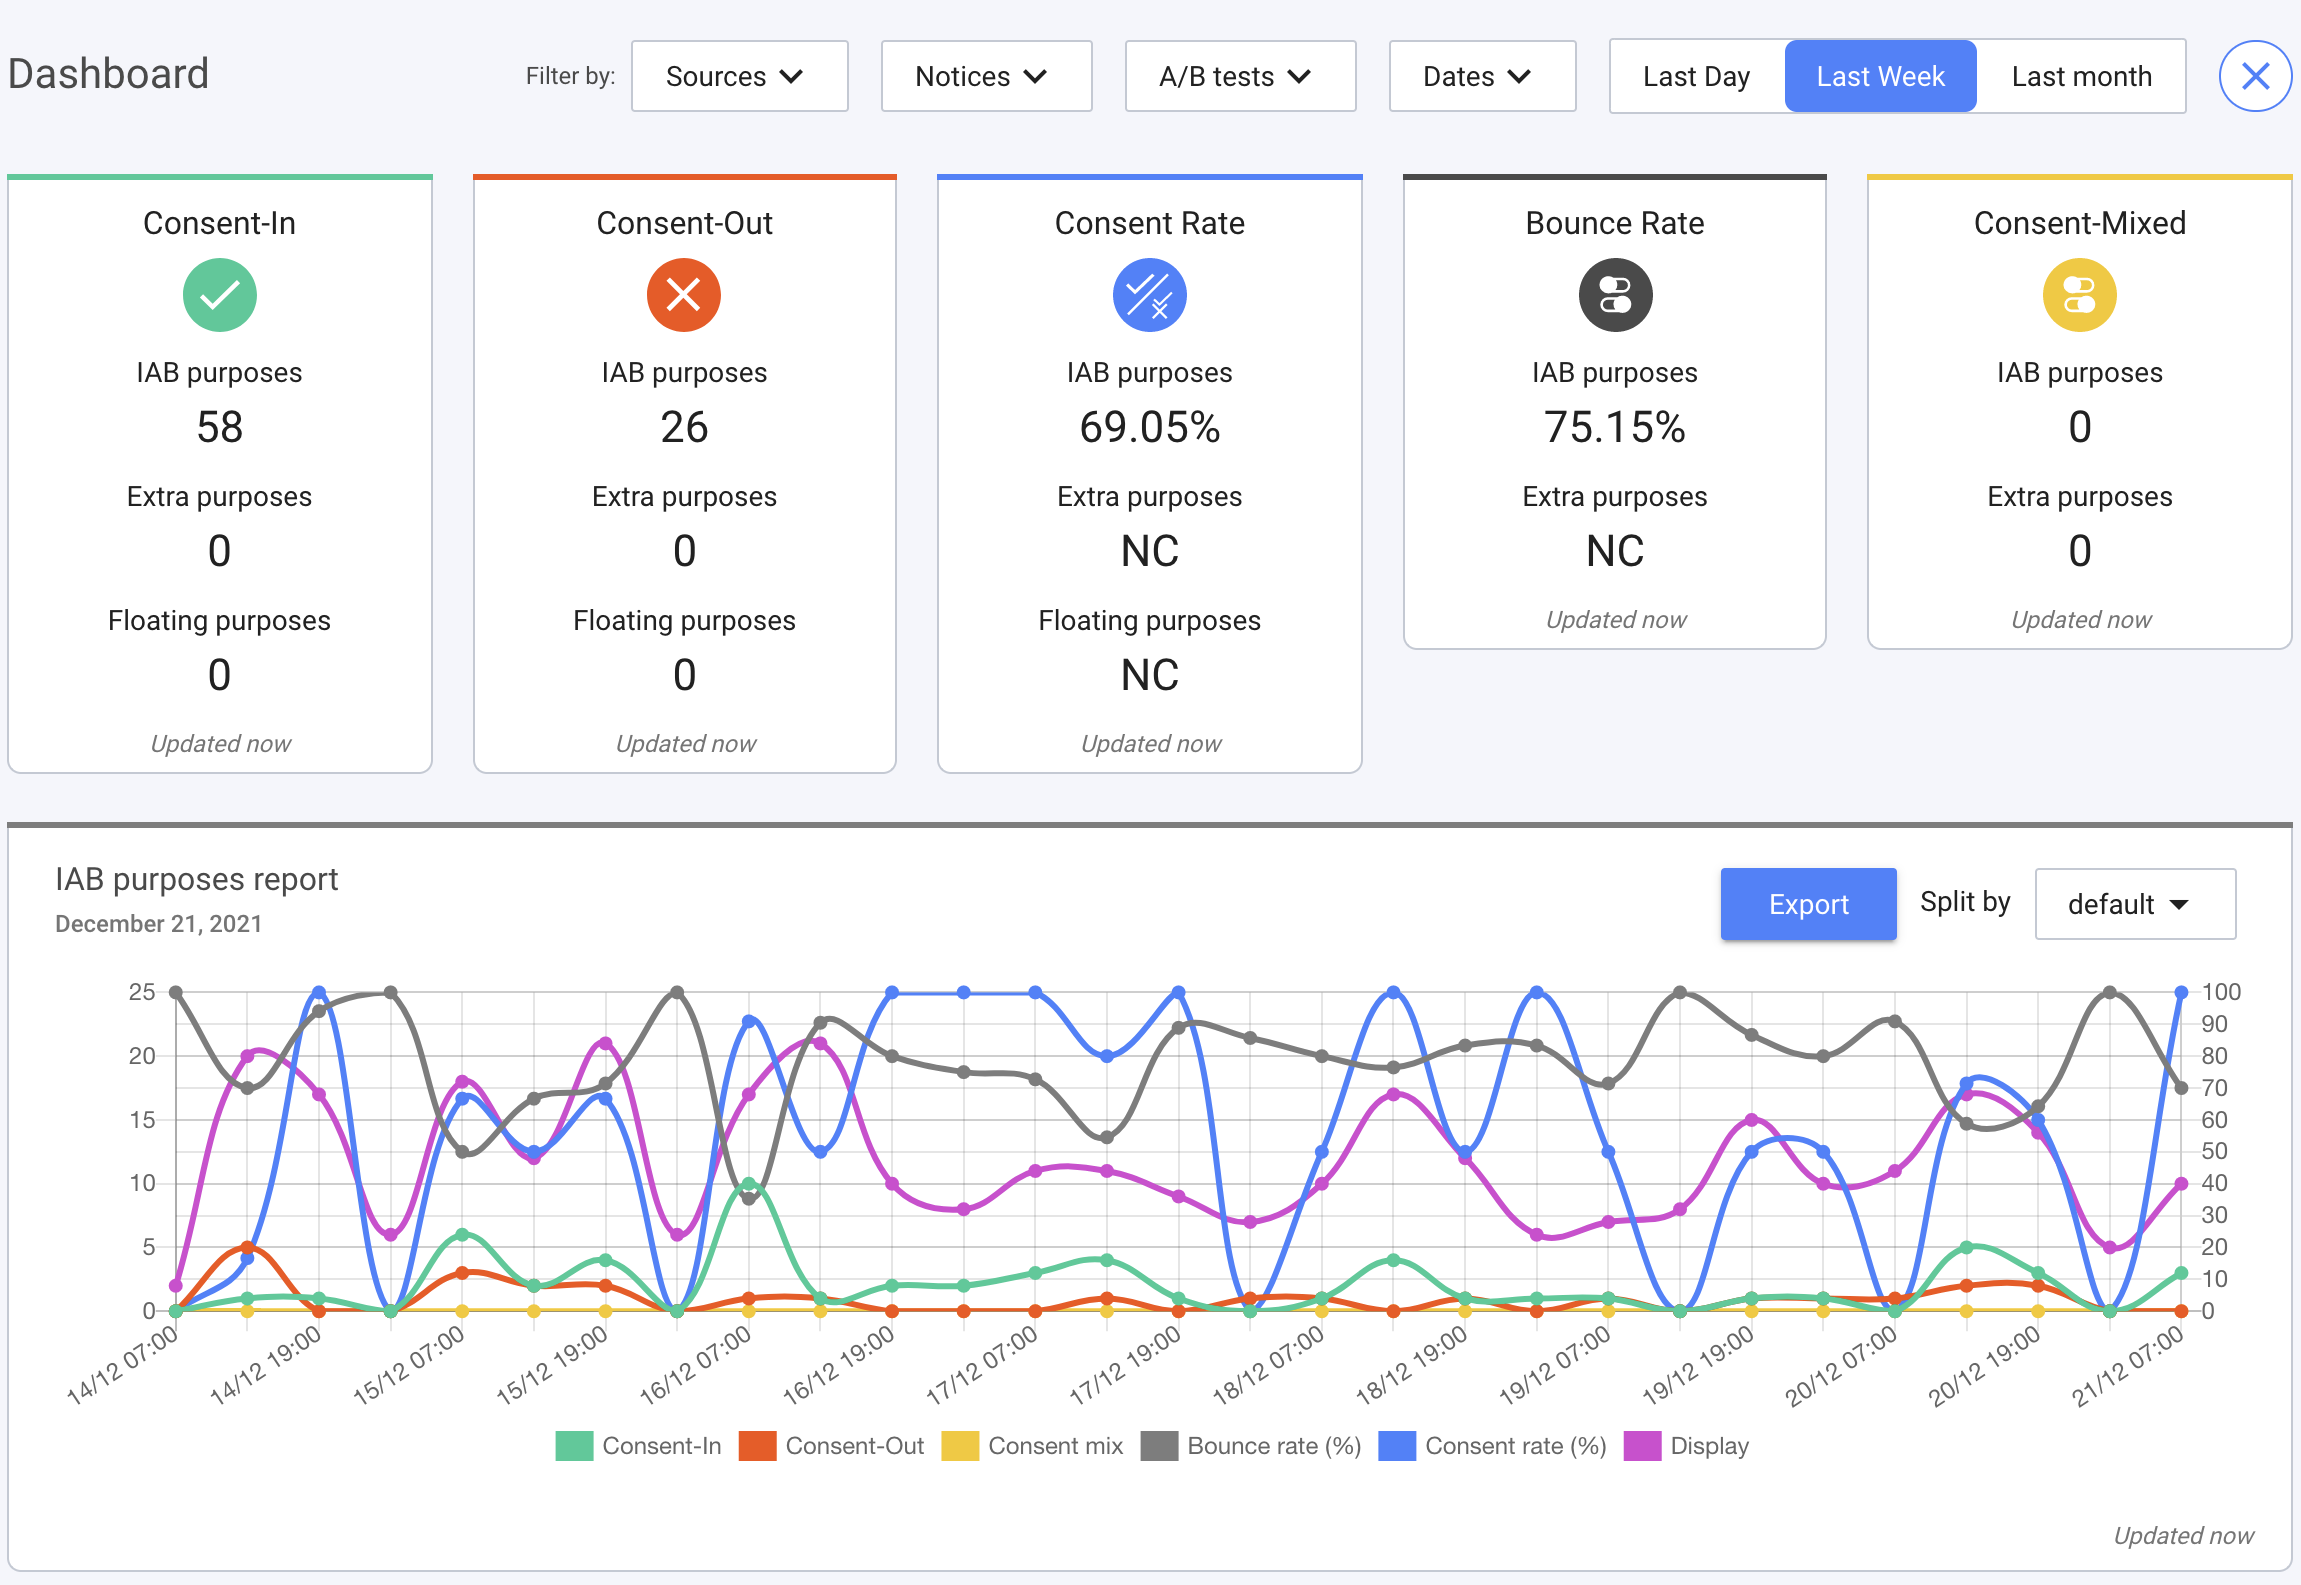
Consent-In
This is the number of positive consents on all the purposes of a notice. By default over the last hour.
Consent-Out
This is the number of negative consents on Graall the purposes of the consent notice. By default over the last hour.
Consent Rate
This is the rate of Consent-In on [consent in + consent out + consent mixed]. By default over the last hour.
Bounce Rate
This is the rate of internet/mobile users who see the consent notice but do not give consent. This metric is calculated over a rolling hour.
Consent Mixed
A mixed IN/OUT signal is raised when a user has a combination of switches that are both positives and negatives. Example: True to Store and/or access information on a device and False on Select basic ads.
Graphic
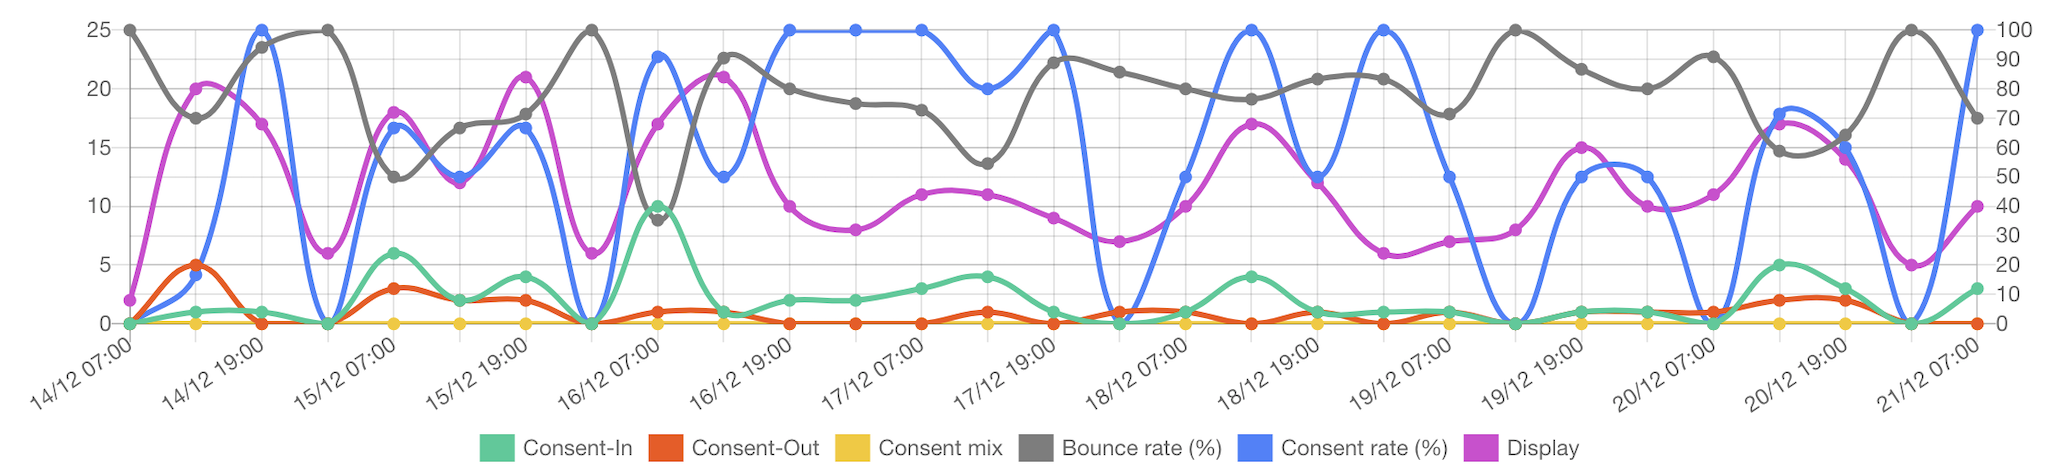
Time Range
Using the selector on the top right corner of the dashboard, you can control the time range of the graph.
